Market Trends - March 2026

Sarasota is a very diverse market. These trends / data points span all single family homes in Sarasota County. We will use similar metrics when developing an offer strategy or pricing your home for sale.

Market trends report for Sarasota County single-family residences for March 2026, showing a horizontal bar indicating market type with seller's market on the left and buyer's market on the right, key details including months of inventory, sold-to-list price percentage, median days in RPR, and median sold price.
A line graph showing median sold home prices in Sarasota County, Florida, from March 2021 to March 2026, with prices ranging from approximately $200,000 to $600,000. The graph indicates a trend of rising prices until mid-2022, followed by fluctuations and a gradual decline.
Line graph showing the supply of inventory from March 2021 to March 2026 in Sarasota County, Florida. The supply starts low, increases steadily until around March 2024, peaks, then decreases again. The top highlights indicate a current supply of 5.04 months, a 6% decrease from the previous month, and a 38.8% decrease over the past year.
Line graph showing the median estimated property value in Sarasota County, Florida from July 2008 to April 2025. The graph compares Sarasota County with Florida state and USA averages, with Sarasota County's value reaching about $450,840 in March 2026. The graph indicates a peak property value around early 2022, followed by a decline.

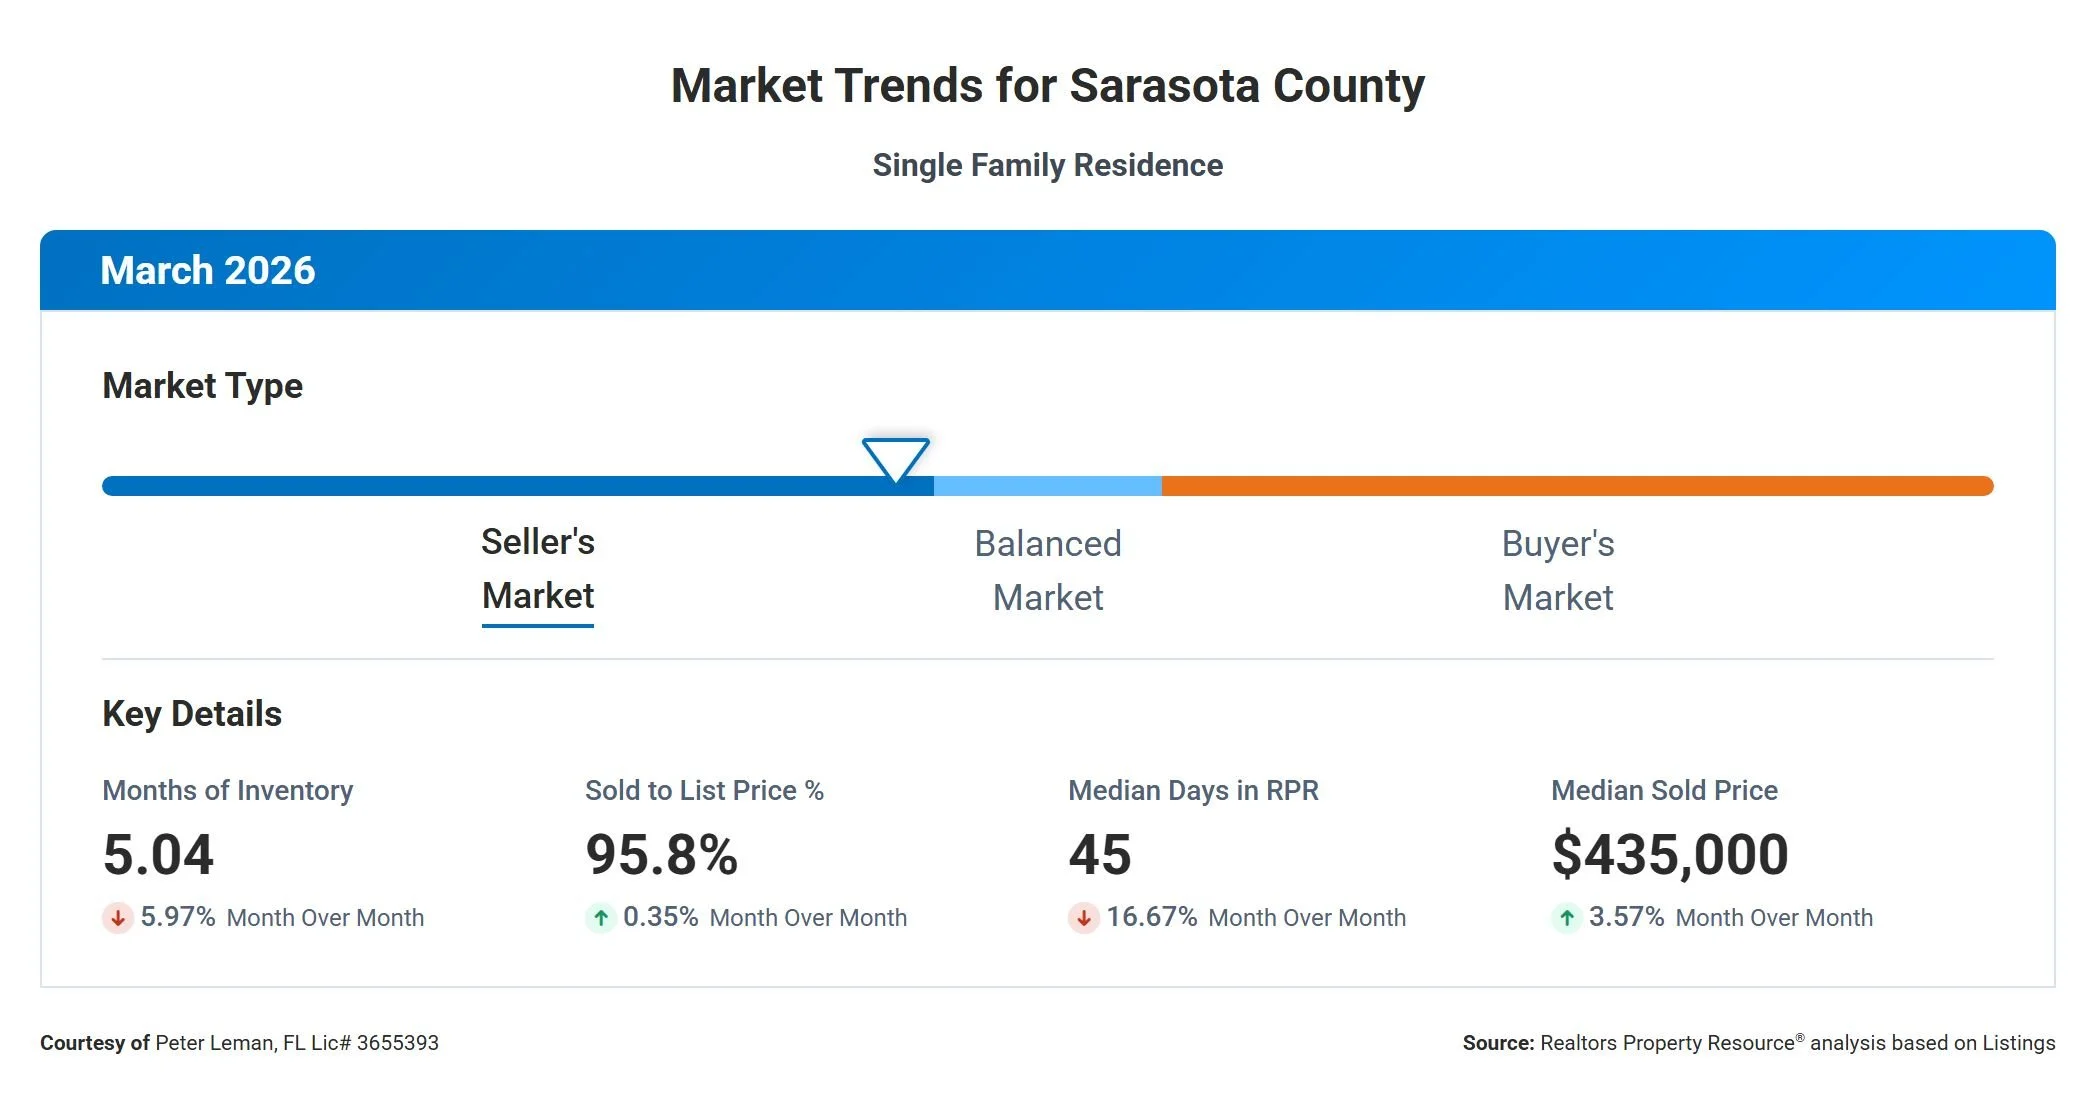
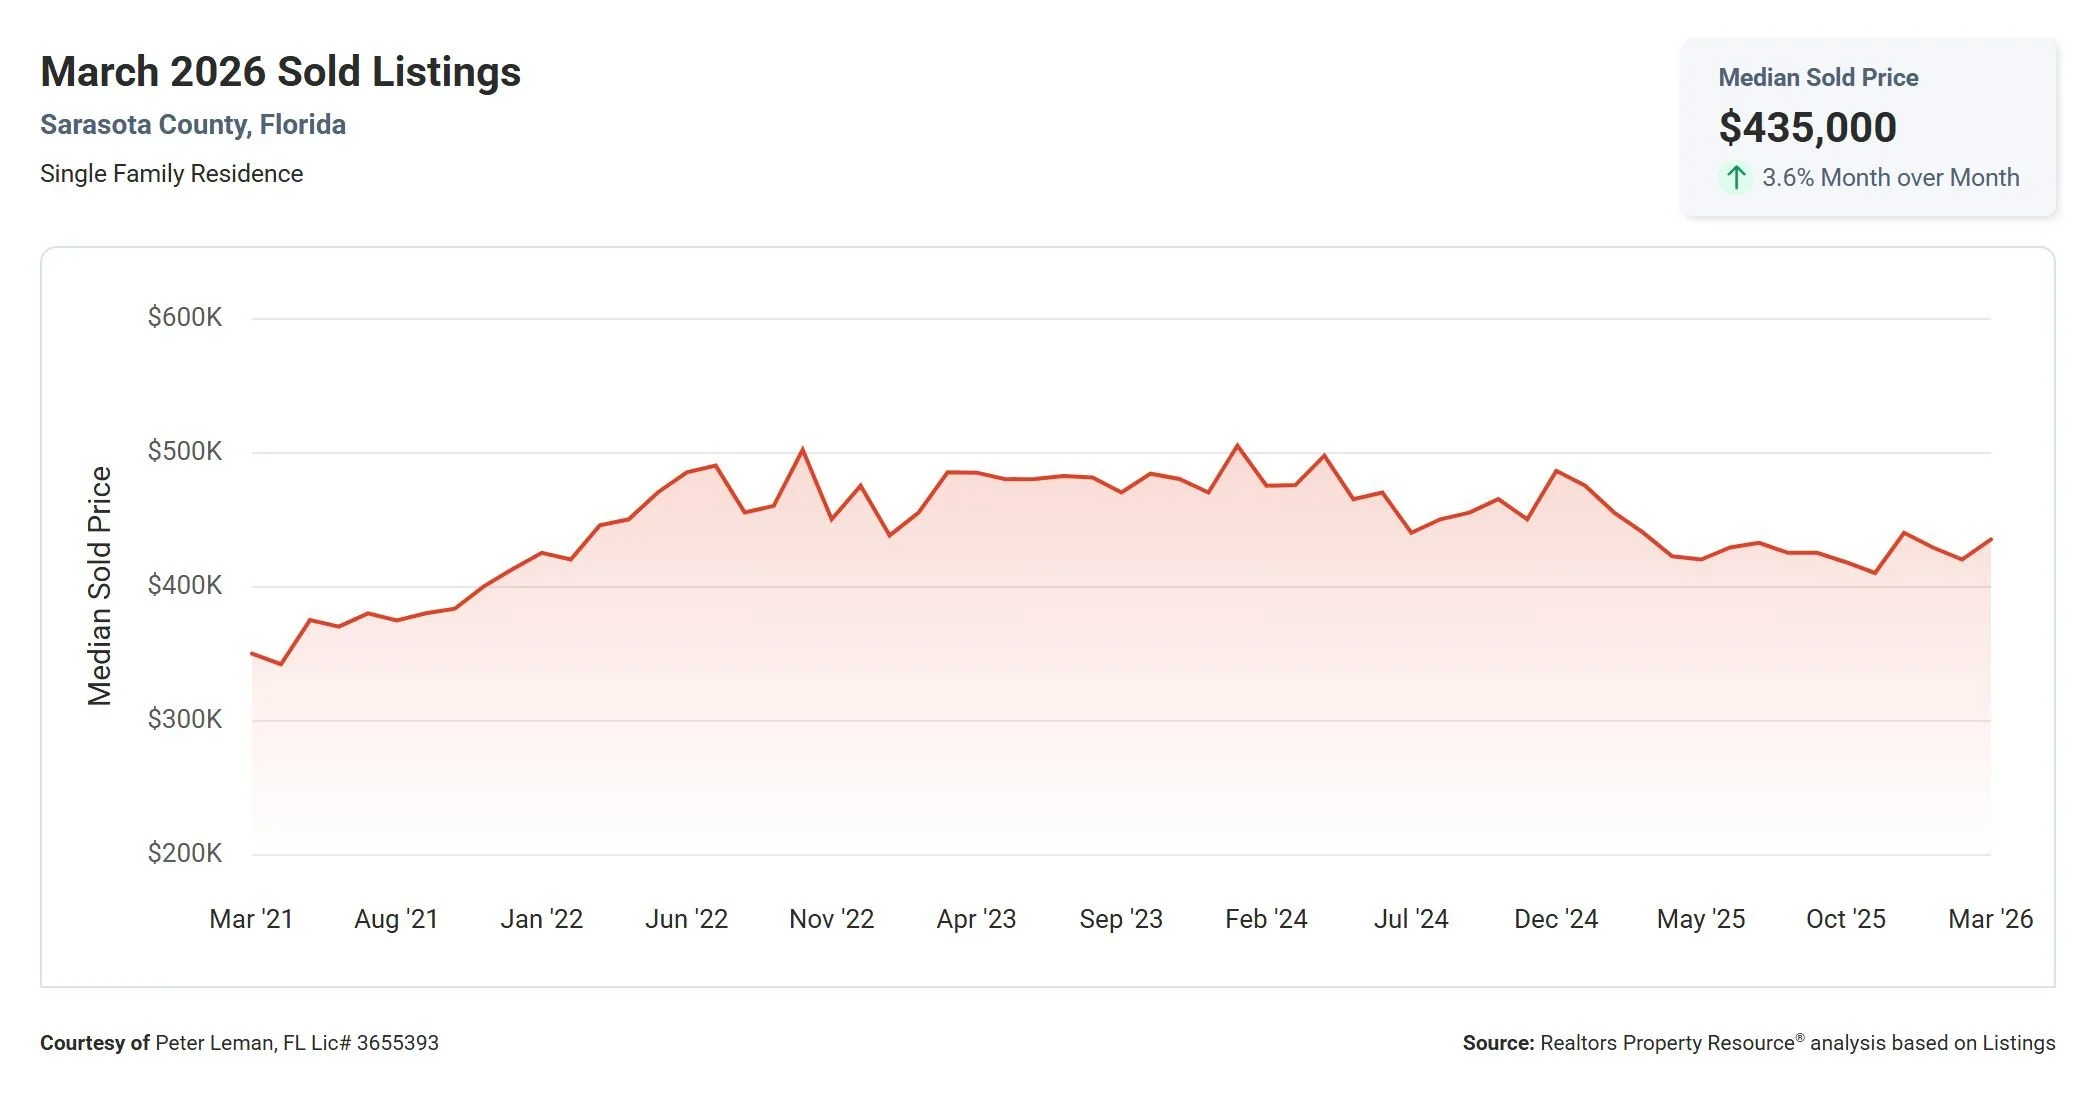
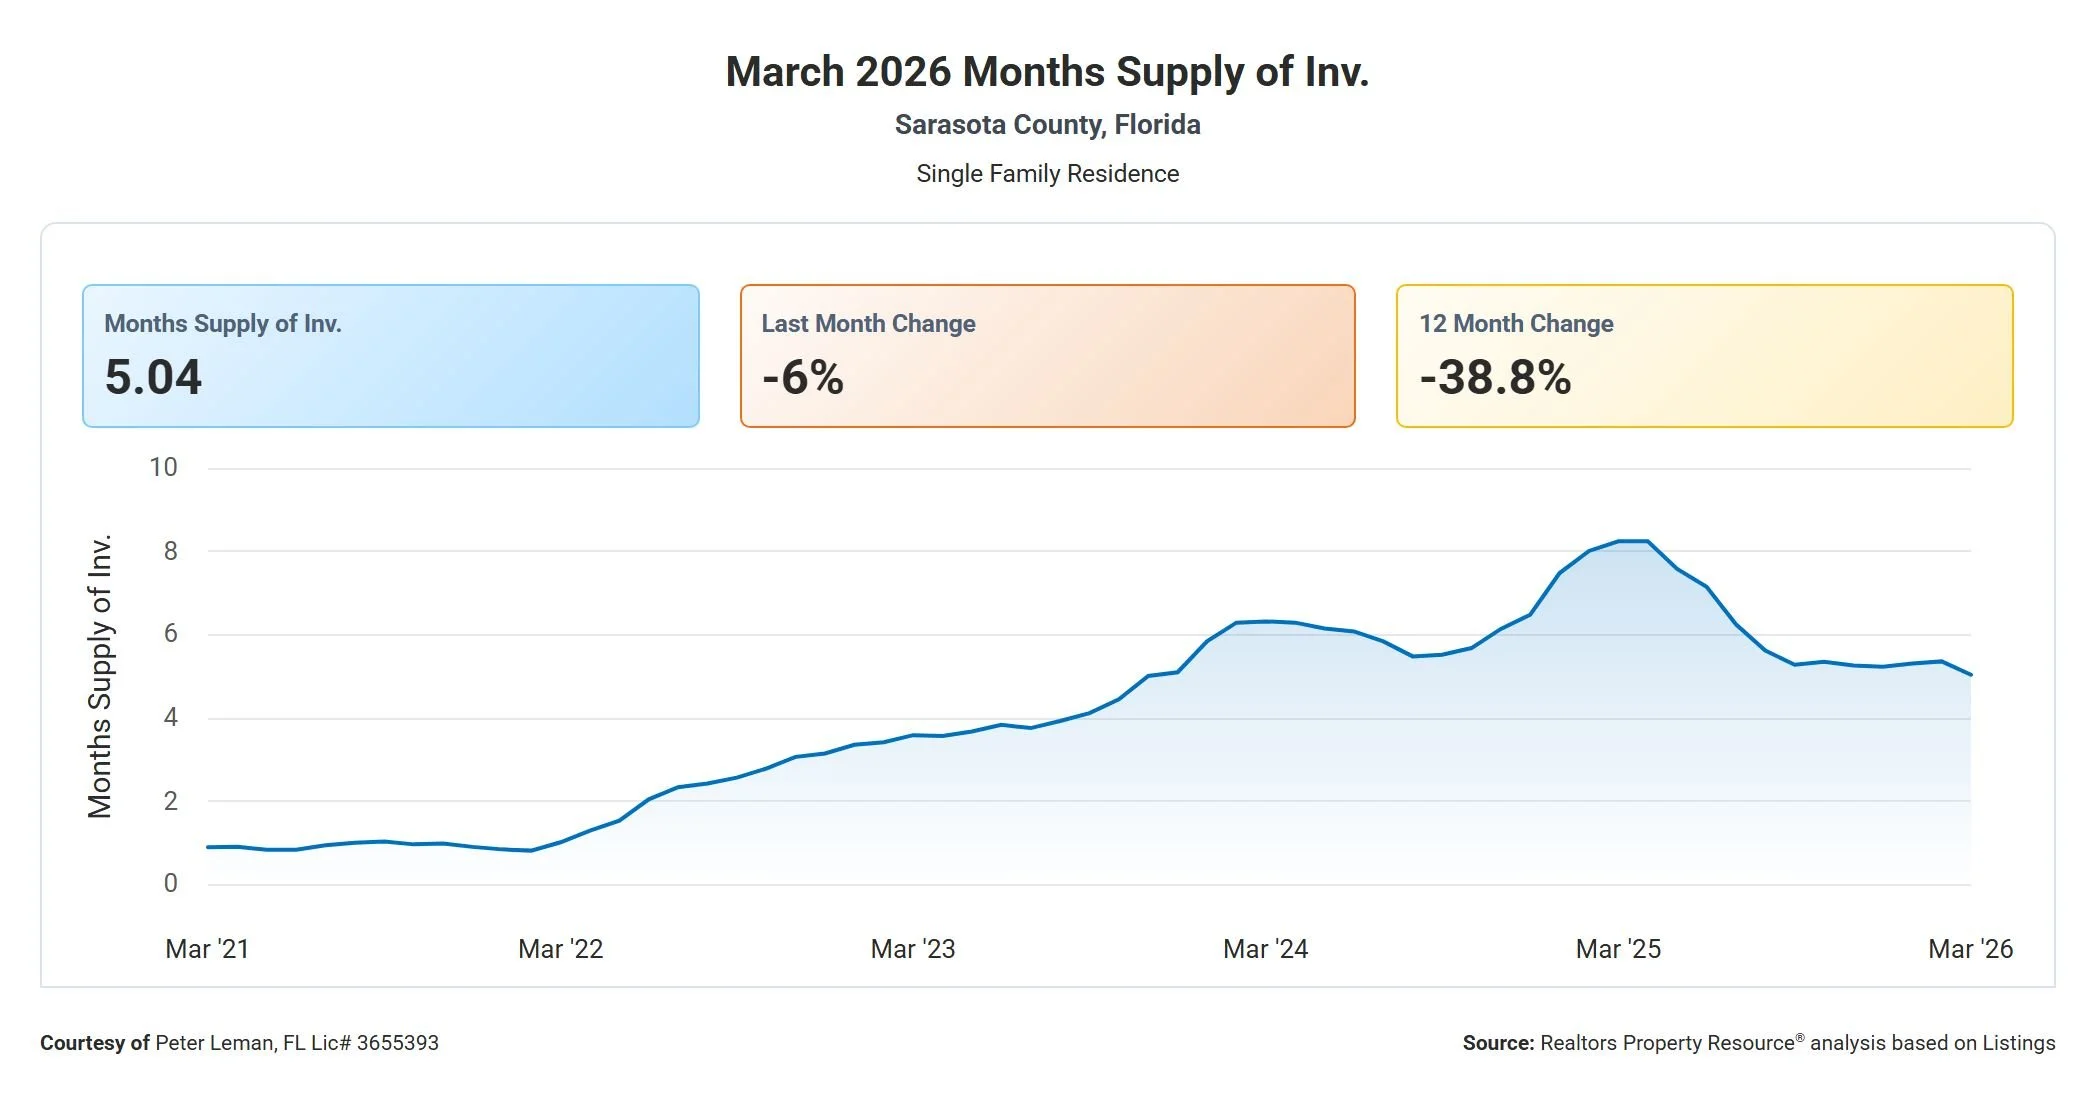
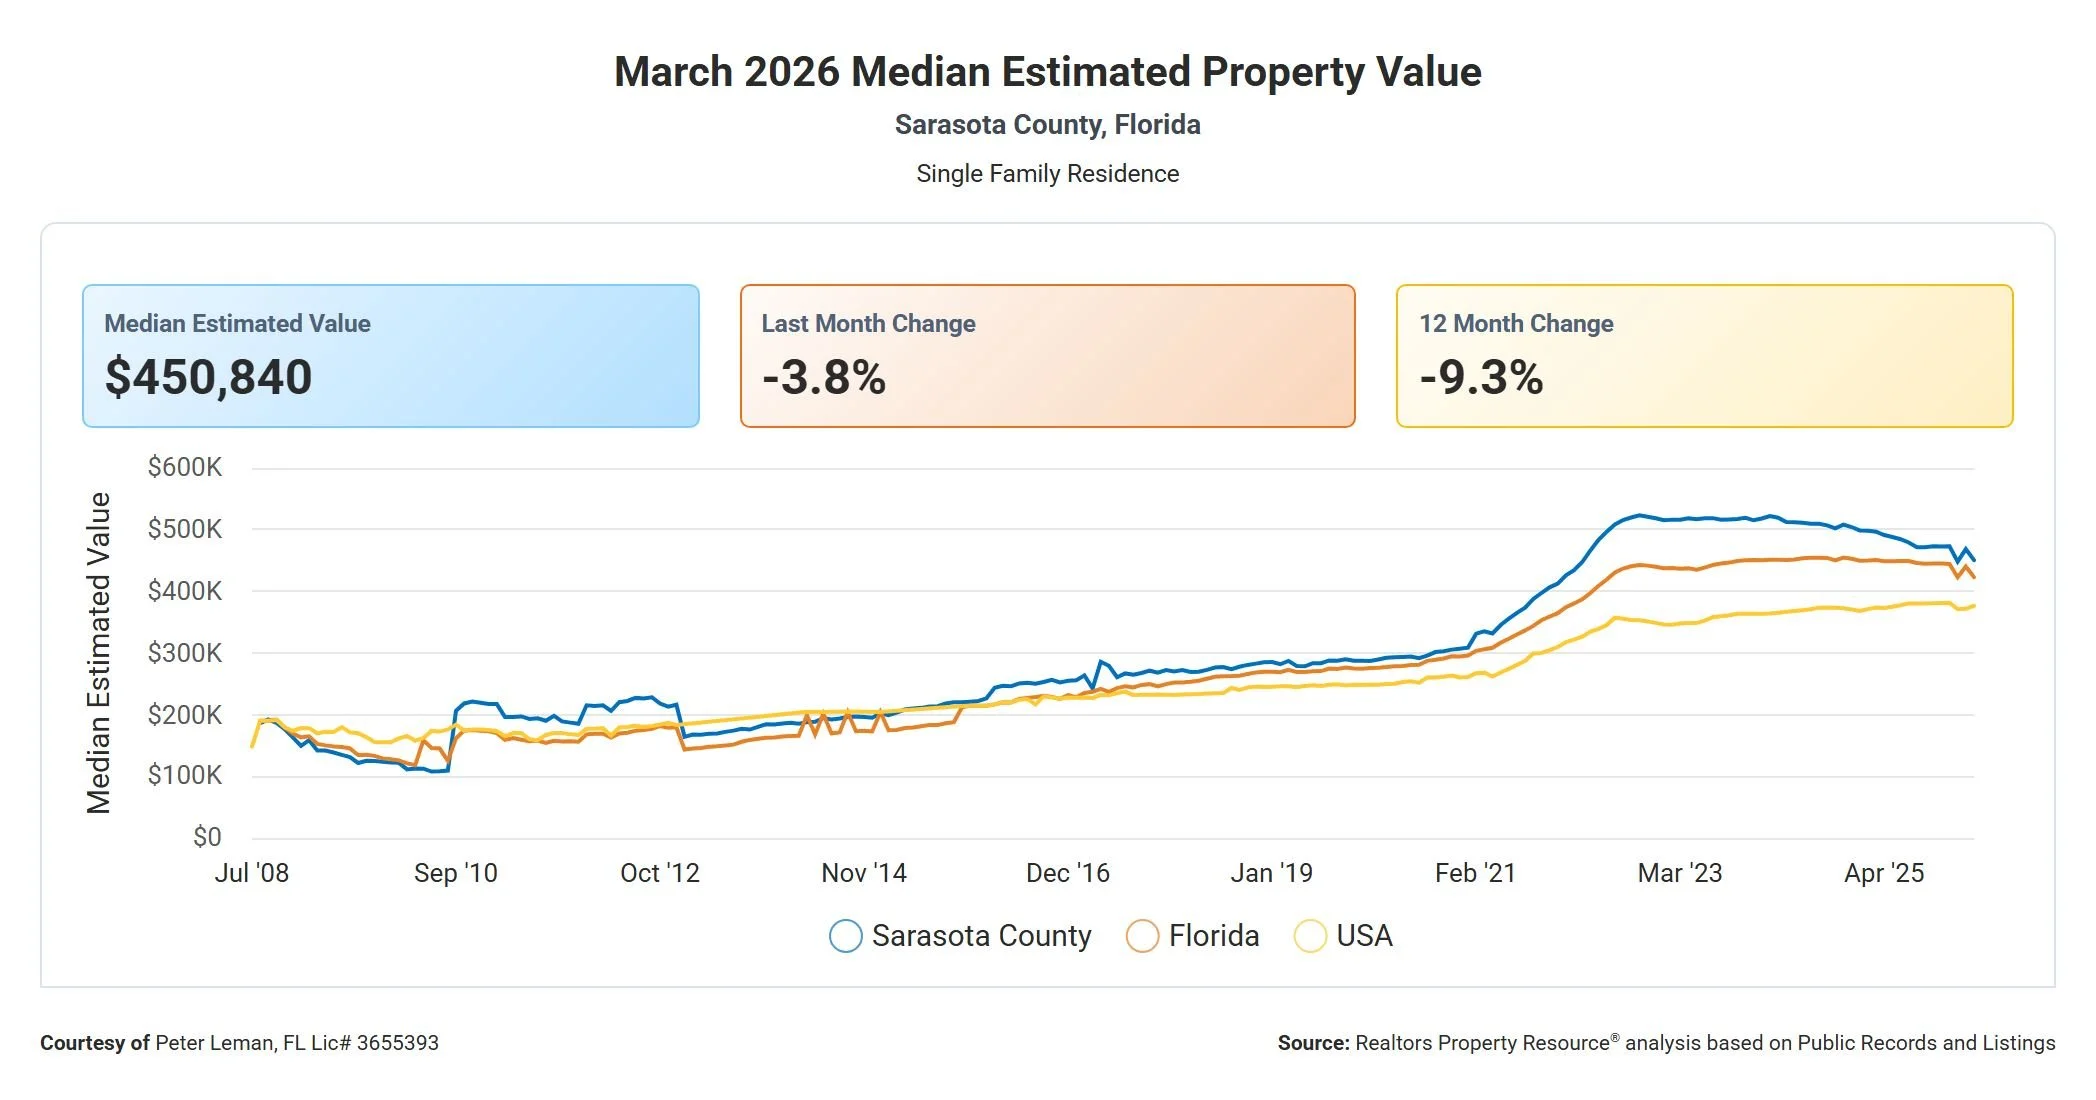
Weekly update on the Sarasota County Real Estate Market.